Visualizations of actual run-time data support the comprehension of programs, like examples support the explanation of abstract concepts and principles. Unfortunately, the required run-time analysis is often associated with an inconvenient overhead that renders current tools impractical for frequent use.
We propose an interactive approach to collect and present run-time data. An initial shallow analysis provides for immediate access to visualizations of run-time information. As users explore this information, it is incrementally refined on-demand. Pathfinder is our implementation that realizes our proposed approach and enables developers to instantly explore run-time behavior of selected code entities. We evaluate our interactive approach by measuring time and memory overhead in the context of ten different-sized projects. Our empirical results show that run-time data for an initial overview can be collected in less than 300 milliseconds for 95% of cases.
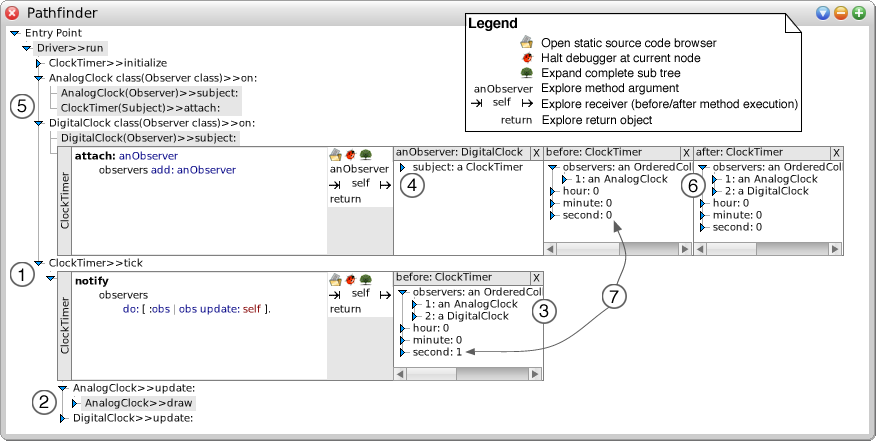
The following figure illustrates our Pathfinder tool and how it helps to better understand program behavior of the observer pattern (Example taken from Gamma, Helm, Johnson, Vlissides - Design Patterns. Elements of Reusable Object-Oriented Software). The example is also available as podcast (1.7 MB).
The visualized information primarily consists of a call tree that reflects a particular run of the application. Some of the tree nodes have been expanded to reveal details. The following details correspond to the indices in the figure.
The data of our empirical evaluation can be found here.
© 2006-2023 HPI Software Architecture Group